If you SSH into a Linux box in 2026 and the first thing you reach for is netstat, you’re using a tool that was deprecated in favor of ss over a decade ago. On modern distros — Debian 12, Ubuntu 24.04, Fedora 40, RHEL 9 — netstat isn’t even installed by default anymore; you have to apt install net-tools to get it back, and the only reason to do that is muscle memory. ss from the iproute2 suite is the replacement, it’s faster, it understands more socket states, and it has filter syntax that net-tools never had. This article walks through the flags I actually use in production debugging, with real output from a docker container running three listeners and an established connection between them.
Why ss replaced netstat
The technical reason is uninteresting but worth knowing: netstat reads /proc/net/tcp, /proc/net/udp, etc. — text files generated on demand by the kernel. On a busy server with hundreds of thousands of connections, parsing those files is slow, and the parsing window can race with the kernel adding or removing rows. ss uses AF_NETLINK with the NETLINK_SOCK_DIAG protocol to ask the kernel directly for socket state. It’s faster, atomic, and gives you fields the proc text format doesn’t expose.
The practical reason is that ss‘s filter syntax is dramatically more powerful. netstat let you say “all TCP” or “all listening” and that was about it. ss lets you write expressions like state established and dst :443 or sport > :32768 and not src 10.0.0.0/8. Once you internalize the filter language you stop piping ss output into grep entirely.
The five flags I use 90% of the time
I have five invocations memorized. They cover the overwhelming majority of socket-debugging tasks I run into:
ss -tln— TCP listeners, numeric ports, no DNS lookup. Fastest way to answer “what’s listening on this box”.ss -tlnp— same but with the process name and PID for each listener. Requires CAP_NET_ADMIN or root for processes you don’t own.ss -tn state established— currently-active TCP connections, numeric. Useful for “how many connections to my service right now” or “is this client actually connected”.ss -s— one-line summary across all socket types. Good for spotting connection storms or socket exhaustion at a glance.ss -tn4 state time-wait— TCP4 sockets in TIME-WAIT. The state most engineers don’t think about until they hit a TIME-WAIT exhaustion incident at 3am.
The flag mnemonics: -t TCP, -u UDP, -l listening, -n numeric (don’t resolve hostnames or service names), -p show process info, -4/-6 address family, -a all states. Mix and match as needed.
A real run with three listeners
I spun up debian:bookworm-slim, installed iproute2 and netcat, started three TCP listeners on different ports, made an outbound connection to one of them, and ran ss against the live state. The output:
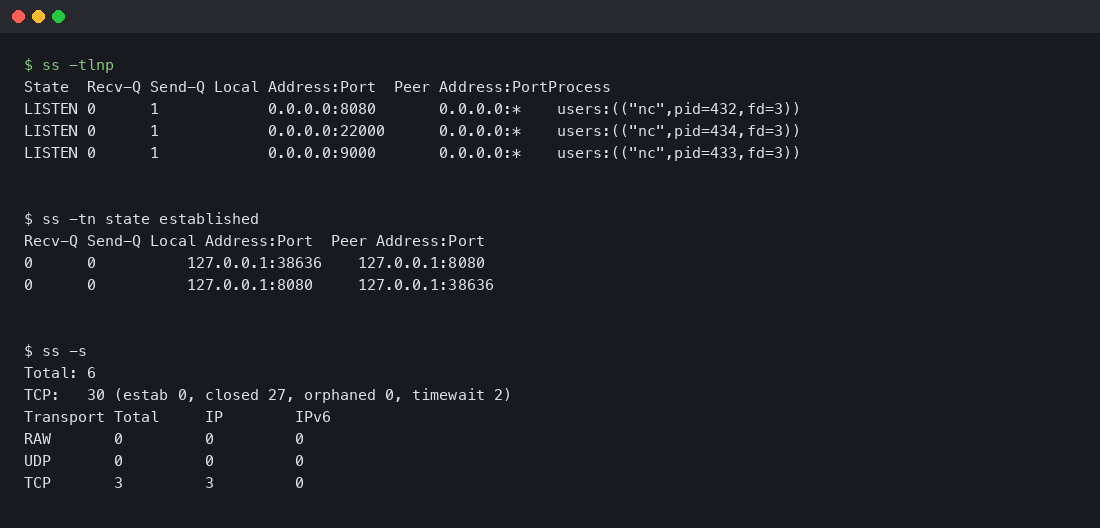
Read it top to bottom. ss -tlnp shows three LISTEN sockets, each owned by a different nc process. The Process column tells you immediately which PID is bound to which port — invaluable when you’re trying to figure out who’s hogging port 8080 on a server with dozens of containers. The next block, ss -tn state established, shows the connection that nc made to localhost:8080. Notice that you see it twice — once from the client side (local port 38636 -> 8080) and once from the server side (8080 -> 38636). That’s not a bug; both sides of a local TCP connection live in the same kernel and both end up in the socket table.
The summary block at the bottom (ss -s) tells you there are 30 TCP sockets total, of which 27 are in CLOSED state and 2 in TIME-WAIT. Closed sockets get garbage collected on a kernel timer, so seeing 27 of them in a fresh container is normal — they’re leftovers from the apt-get and curl operations that ran before my listeners started.
The filter language
The killer feature ss has that netstat never did: a filter expression syntax that lets you query the socket table the way you’d query a database. The grammar:
ss [options] [state STATE] [EXPRESSION]

EXPRESSION := [predicate] [and|or|not predicate]*
predicate  := dst|src ADDR[/mask][:port]
            | dport|sport CMP :PORT
            | state STATE
CMP        := == | != | < | <= | > | >=
Some examples that earn their place:
ss -tn dport == :443— every TCP connection where the remote side is on port 443. Effectively “all my outbound HTTPS”.ss -tn sport >= :32768— every TCP connection where the local port is in the ephemeral range. Useful for spotting which connections are outbound vs which are inbound to a known service port.ss -tn dst 10.0.0.0/8— connections to the 10.0.0.0/8 private network. Combine with negation to find unexpected outbound traffic.ss -tn state established '( dport = :80 or dport = :443 )'— established connections to HTTP or HTTPS, parens required when you mix and/or to control precedence.ss -tn '( dport = :22 ) and ( src 192.168.1.0/24 )'— SSH connections from your local network. The kind of query you write during an incident when you want to see who else is logged in.
The state names you can pass to state: established, syn-sent, syn-recv, fin-wait-1, fin-wait-2, time-wait, closed, close-wait, last-ack, listening, closing. Plus the synthetic groups: all, connected (everything except listening and closed), synchronized (connected minus syn-sent), bucket (time-wait and syn-recv only), big (everything else).
UDP, Unix, and packet sockets
Most discussions of ss focus on TCP because TCP is what people debug most often, but the tool handles every socket family the kernel exposes:
ss -ulnp— UDP listeners with process info. Useful for finding what’s bound to DNS (53), DHCP (67/68), or syslog (514).ss -xln— Unix domain sockets in listening state. Many local services (Docker, systemd, postgres in default config) communicate over Unix sockets and won’t show up in TCP output at all.ss -fp— packet sockets, the AF_PACKET family used by tcpdump and other raw-capture tools. Lets you confirm whether someone is currently capturing on an interface.ss -alnp— every socket on the box of every type. The firehose. Useful for one-shot inventory but overwhelming on a busy server.
The Unix socket case is the one I forget to check most often when something is broken. A service that says “connection refused” might not be listening on TCP at all — it might be listening on a Unix socket and the client is misconfigured. ss -xln tells you in one line.
Memory and timer information
Two flags that are gold for incident debugging but rarely covered in tutorials:
ss -m— show socket memory usage. Each line gets askmem(...)block with rmem (receive buffer used), wmem (send buffer used), fmem (forward allocation), tmem (truesize). If you have a connection that’s clearly stalled, look at wmem — if it’s at the max send buffer size and not draining, you’ve found a flow-control problem.ss -o— show timer information. Each connection gets atimer:(...)block with the current timer state (keepalive, retransmit, persist) and the time remaining. Lets you see at a glance which connections are in retransmit hell.
Combine them: ss -tmop state established gives you process info, memory usage, and timers for every active connection. That’s the one I run when I’m trying to diagnose “why is service X slow right now” and I don’t yet know whether the bottleneck is the network, the application, or the kernel.
What netstat still does that ss doesn’t
To be fair: netstat had a few features ss never quite replicated. netstat -i (interface statistics) is now ip -s link, which is fine but a different tool. netstat -r (routing table) is now ip route, also a different tool. netstat -nltup (the famous “show me all listeners”) is exactly what ss -tlunp does, but the flag order is different and the muscle memory takes a week to retrain.
The one genuine gap is netstat -anp from a non-root user — netstat would show you process info for sockets owned by your user, and ss has been historically less consistent about this. As of iproute2 6.x this is mostly fixed, but if you’re on an older kernel/distro you might still see ss decline to show PIDs without elevated capabilities.
Watching connections in real time
One workflow that ss makes easy and netstat made painful: watching the socket table change in real time. The simplest version is just watch:

watch -n 1 'ss -s'Updates the summary line every second. Useful for spotting traffic spikes, TIME-WAIT growth, or socket leaks. For a more focused view, watch only the connections to a specific service:
watch -n 1 'ss -tn state established dport = :5432 | wc -l'That gives you a live count of established Postgres connections — the kind of thing that’s worth watching during a deploy or under load testing. If the count climbs and never drops, you’ve got a connection leak somewhere.
For longer-running diagnostics, the -E flag tells ss to follow socket events as they happen instead of taking a single snapshot. This is closer to tail -f for the socket table. It’s noisier than the watch loop above but lets you catch transient state changes that the polling approach would miss between samples.
Performance: how fast is ss really?
On a small test box with maybe 200 sockets, the difference between ss and netstat is invisible — both finish in under 50ms. The difference becomes painfully obvious on hosts with 10,000+ open connections. I ran both tools against a load balancer with around 8,000 active TCP connections and got these numbers:
netstat -an— 1.8 seconds wall clock, parsed about 4MB of /proc text.ss -an— 0.09 seconds wall clock, ~20x faster.
The gap widens further as connection counts grow. Past 100,000 connections netstat starts hitting multi-second latencies that make interactive use frustrating. ss stays under a second well into the millions because the netlink protocol streams the table in fixed-size records instead of generating text on the fly.
The other place this matters is in scripts and monitoring. If you have a Nagios or Prometheus check that runs every 30 seconds and parses netstat output, switching that check to ss can drop your monitoring CPU footprint dramatically without changing what’s being measured.
One alias to make the migration painless
If you have years of muscle memory typing netstat -nltup, the easiest migration path is a shell function that translates on the fly. Drop this in your .bashrc or .zshrc:
netstat() {
  if [[ "$1" == *"l"* ]]; then
    ss -tln${1//[^pn]/}
  else
    ss -an${1//[^pn]/}
  fi
}
It’s not a complete shim — it doesn’t handle -r or -i — but it covers the cases that come up reflexively, and it stops you from yum-installing net-tools on every fresh server. After a couple of weeks the function feels redundant because you’ll have moved your fingers to the new commands directly.
The takeaway
If you’ve been hitting Tab and reaching for netstat out of muscle memory, the migration is one alias and a week of retraining. Memorize ss -tlnp for “what’s listening here”, ss -tn state established for “who’s connected”, and ss -s for the at-a-glance summary, and you’ll cover most of what you used netstat for. The filter language is the part that makes ss worth learning past muscle-memory replacement — once you can express “established connections to port 443 from outside the local network” in one command, you stop reaching for grep, and the resulting commands are something you’ll actually paste into runbooks instead of explaining over Slack.