In the modern landscape of high-performance computing, ensuring the stability and efficiency of your infrastructure is paramount. Whether you are managing a single Linux Server hosting a personal project or orchestrating a massive Kubernetes Linux cluster for enterprise applications, the ability to observe, measure, and optimize system resources is the difference between a seamless user experience and a catastrophic outage. Performance monitoring is not merely about watching graphs; it is a proactive discipline that combines Linux Administration skills with modern DevOps practices.
This guide explores the depths of system observability, moving from fundamental Linux Commands to advanced Python Scripting for automation. We will cover how to monitor CPU, memory, and disk I/O across various Linux Distributions such as Ubuntu Tutorial standards, Debian Linux, Red Hat Linux, CentOS, and even enthusiast favorites like Arch Linux and Fedora Linux. By understanding the interaction between the Linux Kernel and user-space applications, administrators can diagnose bottlenecks in web servers like Nginx and Apache, or database systems like PostgreSQL Linux and MySQL Linux.
Section 1: The Linux Toolkit – Mastering CLI Performance Tools
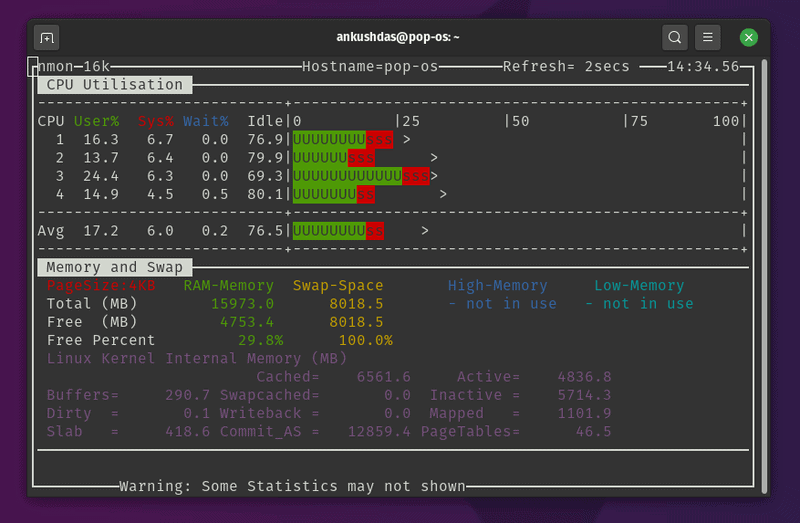
Before diving into complex automation, every system administrator must master the command line. The Linux Terminal provides immediate access to the heartbeat of the system. Tools like the top command have been the industry standard for decades, but modern iterations like htop offer better visualization and interactivity.
Understanding CPU and Load Averages
When a system feels sluggish, the first metric to check is the Load Average. This metric represents the average number of processes waiting for CPU time. In a Linux System Administration context, a load average higher than the number of available CPU cores indicates a bottleneck. While top gives a real-time view, capturing this data over time is essential for trend analysis.
It is also vital to distinguish between User time (processes you run), System time (time spent in the Linux Kernel), and I/O Wait. High I/O Wait often suggests that the CPU is idle because it is waiting for Linux Disk Management operations to complete, which is a common issue in database-heavy environments.
Memory Management and Swap
RAM is a finite resource. When physical memory is exhausted, the kernel moves inactive pages to Swap space on the disk. Since disks are significantly slower than RAM, heavy swapping kills performance. Monitoring tools must track not just total usage, but also the rate of paging. Below is a Bash Scripting example that monitors memory usage and logs it if free memory drops below a critical threshold. This is a fundamental example of Linux Automation.
#!/bin/bash
# Simple Memory Monitor Script
# Usage: Run via cron for periodic checking

LOG_FILE="/var/log/mem_monitor.log"
THRESHOLD=500 # Threshold in MB

# Get free memory in MB
FREE_MEM=$(free -m | grep Mem | awk '{print $4}')

# Get timestamp
DATE=$(date '+%Y-%m-%d %H:%M:%S')

if [ "$FREE_MEM" -lt "$THRESHOLD" ]; then
    echo "[$DATE] CRITICAL: Free memory is low: ${FREE_MEM}MB" >> $LOG_FILE

    # Optional: List top 5 memory consuming processes
    echo "Top 5 Memory Consumers:" >> $LOG_FILE
    ps -eo pid,ppid,cmd,%mem,%cpu --sort=-%mem | head -n 6 >> $LOG_FILE
    echo "----------------------------------------" >> $LOG_FILE
else
    echo "[$DATE] INFO: Memory status normal: ${FREE_MEM}MB free" >> $LOG_FILE
fi
This script utilizes standard Linux Utilities like free, awk, and ps. It can be scheduled using cron, a staple of Linux Server management.
Section 2: Network and Service Monitoring with Python
Performance isn’t just about the hardware; it is about the availability of services. Linux Networking is complex, involving the Linux Firewall (often managed via iptables or ufw), routing tables, and port listeners. Whether you are running a Linux Web Server or a custom application, you need to ensure ports are open and responding.

Open source code on screen – What Is Open-Source Software? (With Examples) | Indeed.com
Security and Connectivity
Before monitoring, ensure your Linux Security posture allows for legitimate traffic while blocking threats. SELinux (Security-Enhanced Linux) and firewalls can sometimes inadvertently block monitoring agents. Always verify Linux Permissions and firewall rules when setting up monitoring endpoints.
Python for DevOps Monitoring
Python Scripting has become the de facto standard for Linux DevOps due to its readability and powerful libraries. While Bash is great for simple tasks, Python Automation allows for complex logic, such as checking HTTP status codes, parsing JSON responses, or interacting with APIs.
The following example demonstrates a Python System Admin script that checks the health of multiple web endpoints (like an internal API or a public website) and measures the response latency. This is crucial for maintaining Service Level Agreements (SLAs).
import requests
import time
import logging
from datetime import datetime

# Configure logging
logging.basicConfig(
    filename='service_health.log',
    level=logging.INFO,
    format='%(asctime)s - %(levelname)s - %(message)s'
)

ENDPOINTS = [
    {"url": "http://localhost:8080/health", "name": "Internal API"},
    {"url": "https://www.google.com", "name": "External Connectivity"},
    {"url": "http://localhost:80", "name": "Nginx Server"}
]

def check_services():
    print(f"Starting check at {datetime.now()}")

    for service in ENDPOINTS:
        start_time = time.time()
        try:
            response = requests.get(service["url"], timeout=5)
            latency = (time.time() - start_time) * 1000 # Convert to ms

            if response.status_code == 200:
                msg = f"{service['name']} is UP. Latency: {latency:.2f}ms"
                print(msg)
                logging.info(msg)
            else:
                msg = f"{service['name']} returned status {response.status_code}"
                print(msg)
                logging.warning(msg)

        except requests.exceptions.RequestException as e:
            msg = f"{service['name']} is DOWN. Error: {str(e)}"
            print(msg)
            logging.error(msg)

if __name__ == "__main__":
    # In a real scenario, this might run in a loop or be triggered by a scheduler
    check_services()
This script requires the requests library. It bridges the gap between Linux Programming and operations, providing actionable data on web service performance.
Section 3: Advanced System Metrics and Container Monitoring
As infrastructure evolves from bare metal to virtualization and containers, monitoring strategies must adapt. Linux Docker and Container Linux technologies introduce a layer of abstraction that can hide performance issues if not monitored correctly. Furthermore, managing Linux Users and File Permissions within containers adds complexity to System Administration.
Granular Resource Tracking with Psutil
For deep introspection, the Python `psutil` (process and system utilities) library is indispensable for Python DevOps. It allows you to retrieve information on running processes and system utilization (CPU, memory, disks, network, sensors) in a portable way. This is particularly useful for Linux Development environments where you need to profile application performance specifically.
Below is an advanced script that monitors specific system metrics, including Disk Usage (critical for LVM and RAID setups) and CPU frequency, which is useful for detecting thermal throttling on bare-metal servers.
import psutil
import platform
import os

def get_system_metrics():
    # System Info
    uname = platform.uname()
    print(f"System: {uname.system}")
    print(f"Node Name: {uname.node}")
    print(f"Release: {uname.release}")

    print("-" * 20)

    # CPU Metrics
    print("CPU Metrics:")
    print(f"Physical Cores: {psutil.cpu_count(logical=False)}")
    print(f"Total Cores: {psutil.cpu_count(logical=True)}")
    # Interval is required to get a non-zero value for CPU usage
    print(f"Current CPU Usage: {psutil.cpu_percent(interval=1)}%")

    print("-" * 20)

    # Memory Metrics
    svmem = psutil.virtual_memory()
    print(f"Total Memory: {get_size(svmem.total)}")
    print(f"Available Memory: {get_size(svmem.available)}")
    print(f"Used Memory: {get_size(svmem.used)}")
    print(f"Percentage: {svmem.percent}%")

    print("-" * 20)

    # Disk Metrics
    print("Disk Partitions:")
    partitions = psutil.disk_partitions()
    for partition in partitions:
        try:
            partition_usage = psutil.disk_usage(partition.mountpoint)
        except PermissionError:
            # Catch errors related to Linux Permissions
            continue

        print(f"Device: {partition.device}")
        print(f"  Mountpoint: {partition.mountpoint}")
        print(f"  File System: {partition.fstype}")
        print(f"  Usage: {partition_usage.percent}%")

def get_size(bytes, suffix="B"):
    """
    Scale bytes to its proper format
    e.g:
        1253656 => '1.20MB'
        1253656678 => '1.17GB'
    """
    factor = 1024
    for unit in ["", "K", "M", "G", "T", "P"]:
        if bytes < factor:
            return f"{bytes:.2f}{unit}{suffix}"
        bytes /= factor

if __name__ == "__main__":
    get_system_metrics()
Monitoring Containers and Cloud Infrastructure
When working with Linux Cloud environments like AWS Linux or Azure Linux, or orchestration tools like Ansible and Kubernetes, you often rely on agents. However, understanding the underlying Linux File System and how containers map storage is crucial. Linux Backup strategies must also be monitored—a backup script that fails silently is a disaster waiting to happen.

Open source code on screen - Open-source tech for nonprofits | India Development Review
For Docker Tutorial followers, remember that docker stats provides a live stream of container resource usage. Integrating this into a Shell Scripting workflow allows for automated alerts if a container exceeds its memory limit.
Section 4: Best Practices and Optimization Strategies
Collecting data is only the first step. The value of performance monitoring lies in how you interpret and act on that data. Here are key best practices for maintaining a healthy Linux Environment.
1. Establish Baselines
You cannot detect an anomaly if you don't know what "normal" looks like. Use tools like sar (System Activity Reporter) to collect historical data. Whether you are using C Programming Linux tools or high-level Python Automation, store your metrics. A spike in CPU usage might be normal during a nightly Linux Backup but critical during business hours.
2. Alerting Fatigue
Do not alert on everything. If your Linux SSH logs show a few failed login attempts, that is normal background noise. If they show 5,000 attempts in a minute, that is a brute-force attack. Configure your monitoring tools to alert on trends and thresholds, not just instantaneous spikes.
3. Tooling and Environment
Open source code on screen - Design and development of an open-source framework for citizen ...
Efficient administrators customize their environment. Using the Vim Editor with syntax highlighting for config files, or using terminal multiplexers like Tmux or Screen, allows you to run monitoring scripts in one pane while debugging Linux Tools in another. Efficiency in the terminal translates to faster incident response.
4. Security Integration
Performance monitoring often overlaps with security monitoring. A sudden spike in outbound network traffic could be a data exfiltration attempt. Tools like iptables logs and Linux Firewall statistics should be ingested into your monitoring solution. Ensure that the Linux Users running your monitoring scripts have the minimum necessary File Permissions to read system stats without exposing sensitive data.
Conclusion
Mastering performance monitoring is a journey that spans the entire stack, from the Linux Kernel to the application layer. By combining traditional Linux Commands with modern Python Scripting and Linux DevOps practices, you can build a robust observability pipeline. Whether you are managing a simple Ubuntu Tutorial server or a complex Kubernetes Linux cluster, the principles remain the same: measure everything, establish baselines, and automate your responses.
As you advance, consider exploring System Programming with GCC or integrating your scripts with enterprise tools. The goal is to move from reactive fire-fighting to proactive system optimization, ensuring your Linux Server infrastructure remains resilient, secure, and high-performing.