In the realm of Linux Administration and modern DevOps, the stability and efficiency of your infrastructure are only as good as your visibility into it. Performance monitoring is not merely a reactive task performed when a server crashes; it is a proactive discipline that ensures high availability, optimal user experience, and cost-efficiency. Whether you are managing a single Ubuntu Tutorial server or a sprawling Kubernetes Linux cluster on AWS Linux, understanding the heartbeat of your system is non-negotiable.
This comprehensive guide explores the depths of system observability. We will move beyond simple uptime checks to deep-dive analysis using the Linux Terminal, custom Python Scripting, and enterprise-grade strategies. We will cover the critical metrics of the Linux Kernel, storage subsystems like LVM and RAID, and the nuances of monitoring Linux Web Server environments running Apache or Nginx. By the end of this article, you will possess the technical knowledge to implement robust monitoring solutions that scale.
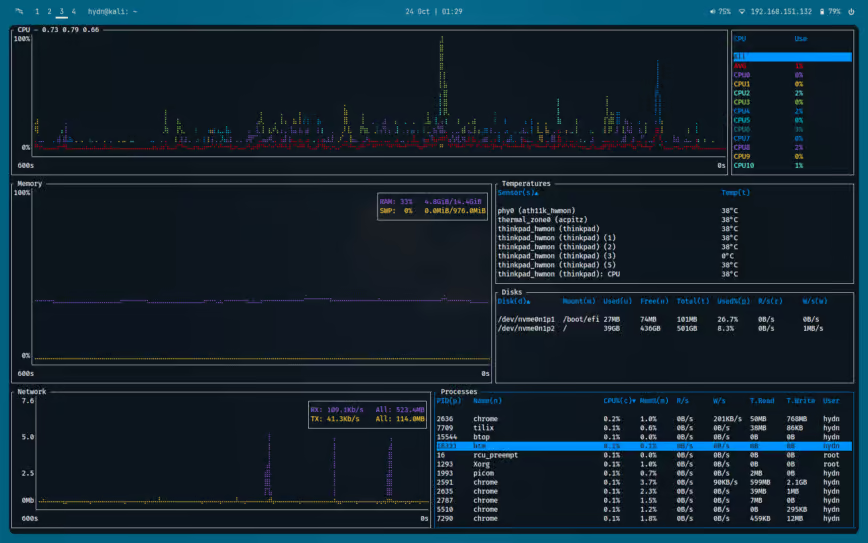
Core Concepts of System Resources and Native Tools
Before implementing complex automation, a System Administrator must master the native utilities provided by Linux Distributions such as Debian Linux, Red Hat Linux, CentOS, and Arch Linux. Performance monitoring generally revolves around the USE method: Utilization, Saturation, and Errors. These metrics apply to the four golden signals: CPU, Memory, Disk I/O, and Network.
CPU and Memory Analysis
The CPU is the brain of your Linux Server. High load averages can indicate processes waiting for CPU time or waiting for Disk I/O. The classic top command is the first line of defense, but modern administrators often prefer htop for its interactive interface and visual representation of per-core usage. However, for historical data and scripting, tools like vmstat are superior.
Memory management in Linux is nuanced. New users often panic when they see “free” memory near zero. However, the Linux Kernel aggressively uses unused RAM for disk caching to speed up Linux File System operations. True memory pressure is identified by examining swap usage (paging) using vmstat or free -m.
Automating Resource Checks with Bash Scripting
While interactive tools are great for spot-checking, Bash Scripting allows for automated logging and simple alerting. Below is a script that monitors CPU load and Memory usage, logging high-resource events to a file. This is a fundamental example of Linux Automation using standard Linux Commands.
#!/bin/bash

# simple_monitor.sh
# A basic resource monitor for Linux Servers

LOG_FILE="/var/log/sys_monitor.log"
CPU_THRESHOLD=80
MEM_THRESHOLD=90

# Ensure the script is run as root or with appropriate Linux Permissions
if [[ $EUID -ne 0 ]]; then
   echo "This script must be run as root"
   exit 1
fi

log_message() {
    echo "$(date '+%Y-%m-%d %H:%M:%S') - $1" >> "$LOG_FILE"
}

# Get CPU usage (idle subtracted from 100)
CPU_USAGE=$(top -bn1 | grep "Cpu(s)" | sed "s/.*, *\([0-9.]*\)%* id.*/\1/" | awk '{print 100 - $1}')

# Get Memory usage percentage
MEM_USAGE=$(free | grep Mem | awk '{print $3/$2 * 100.0}')

# Convert to integers for comparison
CPU_INT=${CPU_USAGE%.*}
MEM_INT=${MEM_USAGE%.*}

if [ $CPU_INT -gt $CPU_THRESHOLD ]; then
    log_message "CRITICAL: CPU usage is at ${CPU_USAGE}%"
    # Optional: Capture the top 5 processes consuming CPU
    ps -eo pid,ppid,cmd,%mem,%cpu --sort=-%cpu | head -n 6 >> "$LOG_FILE"
fi

if [ $MEM_INT -gt $MEM_THRESHOLD ]; then
    log_message "CRITICAL: Memory usage is at ${MEM_USAGE}%"
fi

# Rotate logs if they get too large (Basic Linux Disk Management)
find "$LOG_FILE" -size +10M -exec mv {} {}.old \;
This script demonstrates the power of Shell Scripting. It can be scheduled via Cron to run every minute, providing a rudimentary but effective history of performance spikes without requiring heavy external agents.
Implementation: Network and Process Monitoring with Python
As we move up the stack, Linux Networking becomes a critical focus area. Issues often manifest as latency or dropped packets rather than hard failures. Tools like iptables and Linux Firewall configurations can impact performance if rules are inefficient. Furthermore, monitoring specific applications—whether it is a PostgreSQL Linux database or a custom C Programming Linux application—requires more granular control than Bash can easily provide.
Python System Administration
Python Linux integration is seamless and powerful. Using libraries like psutil, we can write cross-platform monitoring scripts that work on Fedora Linux, Ubuntu, or even macOS. Python allows us to process data structures, interact with APIs, and format output for dashboards. This bridges the gap between System Programming and high-level Linux DevOps workflows.
The following example uses Python to monitor network I/O and specific process states. This is particularly useful for identifying “noisy neighbor” processes that are saturating your network bandwidth.
import psutil
import time
import sys
from datetime import datetime

# Requires: pip install psutil

def get_network_throughput(interval=1):
    """Calculates network sent/recv bytes per second."""
    net_stat_start = psutil.net_io_counters()
    time.sleep(interval)
    net_stat_end = psutil.net_io_counters()

    bytes_sent = net_stat_end.bytes_sent - net_stat_start.bytes_sent
    bytes_recv = net_stat_end.bytes_recv - net_stat_start.bytes_recv

    return bytes_sent, bytes_recv

def monitor_process(process_name):
    """Finds a process by name and logs its resource usage."""
    found = False
    for proc in psutil.process_iter(['pid', 'name', 'username']):
        try:
            if process_name in proc.info['name']:
                found = True
                p = psutil.Process(proc.info['pid'])

                # Get CPU and Memory
                cpu_p = p.cpu_percent(interval=0.1)
                mem_p = p.memory_percent()

                # Get I/O counters (Linux Permissions may restrict this for non-owned processes)
                try:
                    io = p.io_counters()
                    read_bytes = io.read_bytes
                    write_bytes = io.write_bytes
                except psutil.AccessDenied:
                    read_bytes = -1
                    write_bytes = -1

                print(f"[{datetime.now()}] PID: {proc.info['pid']} | Name: {proc.info['name']} | "
                      f"CPU: {cpu_p}% | MEM: {mem_p:.2f}% | "
                      f"Disk Read: {read_bytes} | Disk Write: {write_bytes}")
        except (psutil.NoSuchProcess, psutil.AccessDenied, psutil.ZombieProcess):
            pass

    if not found:
        print(f"Process '{process_name}' not found.")

if __name__ == "__main__":
    print("Starting Network and Process Monitor...")
    print("Press Ctrl+C to stop.")

    target_process = "nginx" # Example: Monitor Nginx Web Server processes

    try:
        while True:
            sent, recv = get_network_throughput()
            print(f"--- Global Network: Sent: {sent/1024:.2f} KB/s | Recv: {recv/1024:.2f} KB/s ---")
            monitor_process(target_process)
            print("-" * 60)
    except KeyboardInterrupt:
        print("\nMonitoring stopped.")
        sys.exit(0)
This Python Automation script provides real-time feedback. It is infinitely extensible; you could modify it to push metrics to a time-series database or send alerts via Slack. It highlights the importance of understanding Linux Users and File Permissions, as accessing I/O counters of processes owned by other users usually requires root privileges or specific capabilities.
Advanced Techniques: Containers, Cloud, and Infrastructure as Code
Modern infrastructure is rarely static. With the rise of Linux Docker and Container Linux technologies, monitoring has shifted from “pet” servers to “cattle” clusters. In a Kubernetes Linux environment, a pod might exist for only a few minutes. Traditional monitoring tools that rely on static IP addresses often fail in these dynamic environments.
Monitoring in the Age of DevOps
Linux DevOps engineers rely on Infrastructure as Code (IaC) to ensure monitoring is baked into the deployment process. Tools like Ansible are essential here. Instead of manually installing monitoring agents on every Azure Linux or AWS Linux instance, you write a playbook.
Below is an Ansible playbook example that automates the setup of a monitoring environment. It installs essential Linux Tools like sysstat (which provides iostat, mpstat, etc.) and ensures the service is running. This ensures that every node in your cluster has the necessary Linux Utilities for performance debugging.
---
- name: Configure Performance Monitoring Tools
  hosts: all
  become: yes  # Requires sudo/root Linux Permissions
  vars:
    monitoring_packages:
      - htop
      - sysstat
      - iotop
      - tcpdump
      - net-tools

  tasks:
    - name: Update apt cache (Debian/Ubuntu)
      apt:
        update_cache: yes
      when: ansible_os_family == "Debian"

    - name: Install monitoring packages
      package:
        name: "{{ item }}"
        state: present
      loop: "{{ monitoring_packages }}"

    - name: Ensure sysstat service is enabled and running
      service:
        name: sysstat
        state: started
        enabled: yes

    - name: Configure SAR (System Activity Reporter) collection interval
      lineinfile:
        path: /etc/default/sysstat
        regexp: '^ENABLED='
        line: 'ENABLED="true"'
      notify: restart_sysstat

    - name: Check Disk Space (Basic Linux Disk Management Check)
      shell: df -h / | awk 'NR==2 {print $5}' | sed 's/%//'
      register: disk_usage
      changed_when: false

    - name: Alert if disk usage is too high
      debug:
        msg: "WARNING: Disk usage is critical on {{ inventory_hostname }}: {{ disk_usage.stdout }}%"
      when: disk_usage.stdout | int > 85

  handlers:
    - name: restart_sysstat
      service:
        name: sysstat
        state: restarted
This playbook exemplifies Linux Automation. It abstracts the differences between Linux Distributions (using the generic package module where possible) and ensures a baseline of observability across your fleet. It prepares the system for deep analysis using tools like sar, which is invaluable for post-mortem analysis of System Monitoring data.


Best Practices and Optimization Strategies
Implementing tools is only half the battle. To truly excel at performance monitoring, one must adhere to best practices that ensure security, reliability, and data integrity.
Security and Permissions
Monitoring agents often require elevated privileges to read kernel counters or inspect network traffic. This presents a security risk. Always adhere to the principle of least privilege. Use SELinux (Security-Enhanced Linux) to confine monitoring processes. If you are using Python Scripting for monitoring, ensure your scripts are not writable by standard Linux Users to prevent privilege escalation attacks.
Furthermore, when monitoring Linux Database systems like MySQL Linux, avoid using the root database user for the monitoring agent. Create a dedicated user with read-only access to the performance schema tables.
Log Management and Rotation
Logs are a heavy contributor to Linux Disk Management issues. A monitoring tool that fills up the disk causes the very outage it was meant to prevent. Configure logrotate for all custom logs. Ensure your Linux Backup strategy includes your monitoring configurations and historical data, especially if you are required to maintain audit trails for compliance.
Granularity vs. Overhead
There is a cost to observation. Running top with a refresh rate of 0.1 seconds consumes significant CPU. Collecting metrics too frequently can degrade the performance of the Linux Kernel and the applications running on it. For production systems, a collection interval of 10 to 60 seconds is usually sufficient for general trends, while 1-second granularity should be reserved for active debugging sessions using tools like Tmux or Screen to maintain persistence.
Conclusion
Performance monitoring is a vast field that encompasses everything from low-level C Programming interactions with the Linux Kernel to high-level Python Automation in the cloud. By mastering the native Linux Terminal tools, leveraging Bash Scripting for quick fixes, and utilizing Python System Admin libraries for complex logic, you can build a robust observability stack.
Whether you are optimizing a Linux Web Server, managing Docker Tutorial containers, or securing a Red Hat Linux enterprise environment, the key is consistency and visibility. Start with the basics, automate your deployment with Ansible, and never stop refining your metrics. A well-monitored system is a stable system, providing the foundation for innovation and growth in the ever-evolving landscape of Linux Development.