In the world of Linux system administration and development, understanding what’s happening under the hood of your operating system is paramount. Whether you’re debugging a slow application, managing a high-traffic Linux server, or simply curious about your system’s resource consumption, you need a tool that provides clear, real-time insights. While the classic top command has been a staple for decades, its modern successor, htop, offers a vastly superior experience with its interactive, color-coded, and user-friendly interface. This tool transforms system monitoring from a cryptic task into an intuitive and efficient process.
This comprehensive guide will take you on a deep dive into htop, moving from basic installation and interface navigation to advanced customization and practical, real-world troubleshooting scenarios. You’ll learn how to manage processes, customize the display to fit your specific needs, and use htop to diagnose common performance bottlenecks. By the end of this article, you’ll not only understand how to use htop but also how to leverage it as a primary tool in your Linux administration and DevOps toolkit, enabling you to keep your systems running smoothly and efficiently.
Getting Started with htop: Installation and Interface Deep Dive
Before you can harness the power of htop, you need to install it. Fortunately, it’s available in the default repositories of most major Linux distributions, making installation a straightforward process. Once installed, launching it is as simple as typing htop in your Linux terminal.
Installation on Common Linux Distributions
Open your terminal and use the appropriate command for your system. This is a one-time setup that will make the htop utility available system-wide.
# For Debian, Ubuntu, and other APT-based systems
sudo apt-get update
sudo apt-get install htop

# For RHEL, CentOS, Fedora, and other DNF/YUM-based systems
sudo dnf install htop
# Or for older versions:
# sudo yum install htop

# For Arch Linux and other Pacman-based systems
sudo pacman -S htop
Understanding the htop Interface
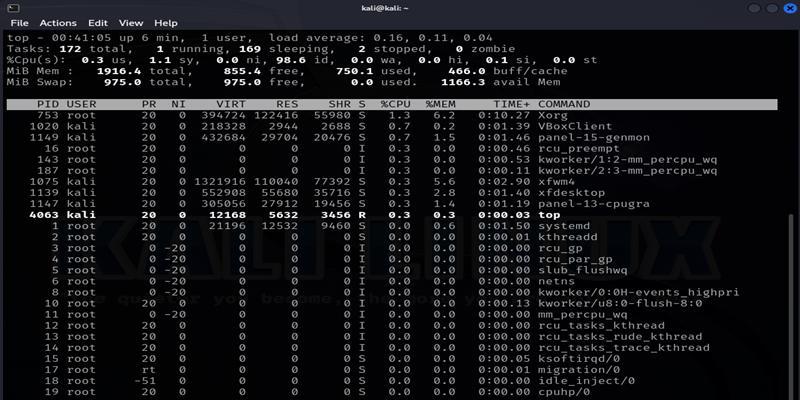
Upon launching htop, you’re greeted with a feature-rich display that is divided into three main sections: the Header, the Process List, and the Footer.
1. The Header: Your System’s Dashboard
The top section provides a high-level overview of your system’s core resources:
- CPU Meters: Displays usage for each CPU core or thread. The colors are significant: Blue for low-priority (“nice”) processes, Green for normal user processes, Red for kernel processes, and Yellow for I/O wait time.
- Memory (Mem) and Swap: Shows total memory and swap space, along with current usage. The colors here indicate: Green for used memory, Blue for buffers, and Yellow for cache.
- Tasks: Displays the total number of tasks (processes), the number of running tasks, and the number of threads.
- Load average: Shows the average system load over the last 1, 5, and 15 minutes. This is a key indicator of system business and can help identify sustained high loads.
- Uptime: The duration since the system was last booted.
2. The Process List: The Heart of htop
This is a scrollable list of all running processes on the system. By default, it includes several columns:
- PID: The unique Process ID.
- USER: The owner of the process.
- PRI / NI: The process’s priority and “nice” value, which influences its scheduling priority.
- VIRT / RES / SHR: Columns detailing memory usage: virtual, resident (physical), and shared memory.
- S: The state of the process (e.g., R for running, S for sleeping, Z for zombie).
- CPU%: The percentage of CPU time the process is currently using.
- MEM%: The percentage of physical memory the process is using.
- TIME+: The total CPU time the process has consumed since it started.
- Command: The full command that launched the process.
3. The Footer: Your Interactive Command Center
The bottom bar displays a menu of available actions, mapped to the function keys (F1 to F10). This is what makes htop truly interactive. You can use these keys or their single-character shortcuts to perform actions without leaving the interface.
Interactive Operations: Managing Processes Like a Pro
The real power of htop lies in its interactivity. You can manipulate the process list and interact with processes directly from the interface, making it an indispensable tool for active system administration.
Navigating, Sorting, and Searching
Basic navigation is intuitive. Use the Up/Down/Left/Right arrow keys to move the cursor and scroll the process list. PageUp, PageDown, Home, and End keys work as expected for faster navigation.
- Sorting (F6 or < / >): Press
F6to bring up a list of columns to sort by. You can easily find resource hogs by sorting byCPU%orMEM%. - Searching (F3 or /): Press
F3to search for a process by name. As you type,htopwill highlight matching processes. This is much faster than pipingpsthroughgrep. - Filtering (F4 or \): Filtering is even more powerful. Press
F4to enter a string, andhtopwill display only the processes whose command line contains that string. For example, filtering for “nginx” will show you all Nginx web server processes.
Tree View and Process Management
Understanding the relationship between processes is crucial for debugging. htop makes this easy.
- Tree View (F5 or t): Toggling this view organizes processes into a parent-child hierarchy. This is incredibly useful for seeing which process spawned others, which is essential when analyzing shell scripts or complex applications like Apache or systemd services.
To see this in action, you can run a simple bash script that creates child processes and observe it in htop‘s tree view.
#!/bin/bash
# parent_script.sh
echo "Parent process starting with PID: $$"
echo "Sleeping for 30 seconds..."

# Spawn a child process
(sleep 20; echo "Child 1 finished") &
echo "Spawned child 1 with PID: $!"

# Spawn another child process
(sleep 25; echo "Child 2 finished") &
echo "Spawned child 2 with PID: $!"

wait
echo "Parent process finished."
Run this script (bash parent_script.sh), then quickly switch to htop, press F5 for tree view, and F3 to search for “parent_script.sh”. You will see the script and its child sleep processes nested underneath it.
Sending Signals to Processes (F9 or k)
One of the most common administrative tasks is terminating a misbehaving process. htop provides a safe and controlled way to do this.
- Select the process you want to manage using the arrow keys.
- Press
F9orkto bring up the “kill” menu. - On the left, you’ll see a list of signals you can send. The most common are:
- 15 SIGTERM: The default. This is a polite request for the process to terminate, allowing it to shut down gracefully (e.g., save files, close connections).
- 9 SIGKILL: The “last resort.” This signal forcefully terminates the process immediately, without giving it a chance to clean up. Use this when a process is completely unresponsive.
- 1 SIGHUP: Often used to tell a daemon to reload its configuration file.
- Select the desired signal and press Enter.
Customizing htop for Your Workflow
A great tool adapts to its user. htop is highly customizable, allowing you to create a monitoring view perfectly tailored to your needs. All customization happens within the Setup menu, accessed by pressing F2 or S.

Configuring Meters, Display Options, and Columns
Inside the Setup menu, you navigate with arrow keys and make changes with the spacebar or Enter.
- Meters: In the “Meters” section, you can change the style of the header displays (e.g., from bar graphs to text or LED-style). You can also add new meters, such as for network I/O (
LeftandRightcolumns) or disk I/O, if your kernel supports it. - Display Options: This section lets you toggle various behaviors. A particularly useful option is “Display threads in a different color,” which helps distinguish main processes from their individual threads. You can also choose to hide userland or kernel threads to reduce clutter.
- Columns: This is arguably the most powerful customization feature. You can add, remove, and reorder the columns shown in the process list. Go to the “Columns” section, and you’ll see “Available Columns” and “Active Columns.” You can add columns like
IO_READandIO_WRITEto monitor disk activity per process, orPROCESSORto see which CPU core a process is running on. This is invaluable for diagnosing I/O-bound or CPU-bound performance issues.
Once you’ve configured your view, press F10 to save and exit. Your custom layout will be saved to ~/.config/htop/htoprc and will be the default view next time you launch htop.
Using Command-Line Flags
You can also modify htop‘s behavior at launch with command-line flags. This is useful for scripting or creating aliases for common tasks.
# Start htop showing only processes for the 'www-data' user
htop -u www-data

# Monitor a specific list of Process IDs (PIDs)
# Useful for focusing on a specific application stack, e.g., a web server and database
htop -p 1234,5678

# Start htop with a slower, 3-second refresh interval (30 tenths of a second)
htop -d 30

# Start htop in monochrome mode, useful for terminals with limited color support
htop -C
Advanced Use Cases and Best Practices
With a solid understanding of the basics, you can now apply htop to solve real-world problems and follow best practices for effective system monitoring.
Diagnosing Performance Issues
- High CPU Usage: If your system is slow, the first step is often to sort by
CPU%inhtop. This immediately reveals which process is consuming the most CPU cycles. If a single process is at 100% on a multi-core system, it might be a single-threaded application that’s maxed out. If total CPU usage is high across all cores, you may have a system-wide load issue. - Memory Leaks: To spot a potential memory leak, sort by
MEM%orRES(resident memory). Watch for a process whose memory usage continually climbs over time without ever decreasing. This indicates the application is allocating memory but not releasing it, which can eventually crash the application or the entire system. - Disk I/O Bottlenecks: If your application is slow but CPU and memory usage are low, you might have an I/O bottleneck. Customize your
htopcolumns to includeIO_RATE,IO_READ, andIO_WRITE. Sort by these columns to see which process is heavily reading from or writing to the disk. This is a common issue for database servers and applications that process large files.
Monitoring Containers and Best Practices
When running in a modern Linux DevOps environment with Docker or Kubernetes, htop on the host machine will show all processes, including those running inside containers. While dedicated tools like ctop exist, htop is excellent for seeing the total impact of all containers on the host’s resources. You can use the filter feature to isolate processes related to a specific container.
Best Practices for Using htop:
- Terminate Gracefully: Always try to kill a process with
SIGTERM (15)before resorting toSIGKILL (9). This gives the application a chance to shut down cleanly. - Customize Your View: Don’t stick with the defaults. Add columns that are relevant to your work. For a database administrator, I/O and memory columns are critical. For a developer running compile jobs, CPU and process priority are more important.
- Understand Load Average: The load average is not the same as CPU usage. It represents the number of processes waiting for CPU time (in the run queue). A load average higher than the number of CPU cores indicates that the system is overloaded and tasks are having to wait.
- Combine with Other Tools:
htopis for real-time monitoring. For historical analysis, combine it with tools likesar,Prometheus, orGrafana. For network-specific issues, usenethogsoriftop.
Conclusion: Your Go-To Monitoring Tool
htop is more than just a prettier version of top; it’s a fundamental evolution in interactive, real-time system monitoring. Its intuitive design, powerful customization options, and direct process management capabilities make it an essential utility for anyone working with Linux. From quickly identifying a resource-hungry process on your personal Ubuntu desktop to managing a complex application stack on a production Red Hat Linux server, htop provides the clarity and control you need to keep systems healthy.
By integrating the techniques covered in this guide into your daily workflow, you can move from being a reactive administrator to a proactive one. Make it a habit to have an htop window open when deploying new code or troubleshooting issues. As a next step, explore other specialized monitoring tools like iotop for disk I/O, nethogs for network traffic, and glances for an even broader, at-a-glance system overview. Mastering htop is a significant step toward becoming a more confident and competent Linux professional.