In the realm of System Administration, visibility is everything. Whether you are managing a high-traffic Linux Web Server running Nginx or debugging a complex Kubernetes Linux cluster, understanding the real-time state of your system is non-negotiable. While modern tools like Ansible and Prometheus offer centralized monitoring, the humble top command remains the most ubiquitous and immediate tool in the Linux Terminal arsenal. It provides a dynamic, real-time view of a running system, serving as the first line of defense against performance degradation.
This comprehensive guide goes far beyond the basics. We will dissect the top command line by line, explore advanced filtering techniques, and demonstrate how to integrate system monitoring into your Linux DevOps workflows using Python Scripting and Bash Scripting. Whether you are running Ubuntu Tutorial labs, enterprise Red Hat Linux, or a lightweight Arch Linux distribution, mastering top is essential for maintaining system health and security.
Section 1: Decoding the Dashboard – Understanding System Metrics
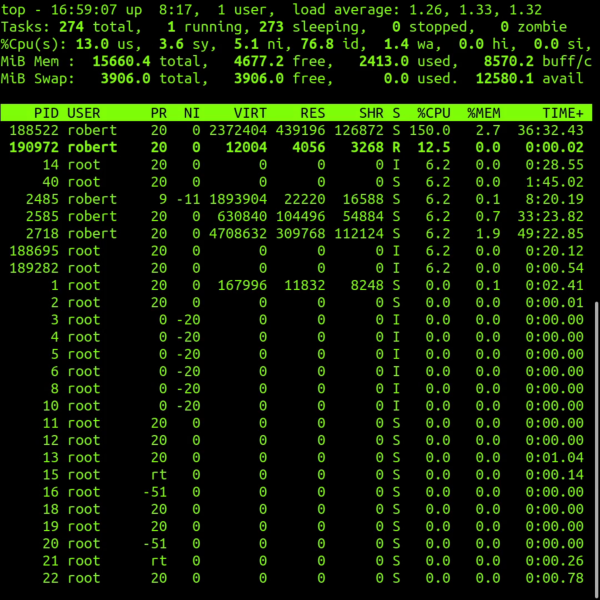
When you first execute top in your Linux Shell, you are presented with a summary area (the “dashboard”) followed by a list of tasks. Many junior administrators glance at the CPU percentage and move on, missing critical data hidden in the header.
The Summary Area Breakdown
The first five lines of the top output contain a wealth of information regarding the Linux Kernel state:
- Line 1 (Uptime & Load): Displays the current time, system uptime, number of logged-in Linux Users, and load averages (1, 5, and 15-minute intervals). The load average is crucial; it represents the number of processes waiting for CPU time or disk I/O.
- Line 2 (Tasks): Shows the total number of tasks and their states: running, sleeping, stopped, or zombie. A high number of zombie processes can indicate issues with parent processes not handling child termination signals correctly (common in C Programming Linux).
- Line 3 (CPU States): This is often the most misunderstood line. It breaks down CPU usage into:
us: User space (applications).sy: System space (kernel operations).ni: Processes with manually adjusted nice values.id: Idle time.wa: I/O wait time (critical for diagnosing Linux Disk Management issues).hi/si: Hardware and Software interrupts.st: Steal time (vital for AWS Linux or virtualized environments).
To understand how top gathers this data, we can look at how we might replicate retrieving load averages using Python System Admin techniques. top reads from the /proc virtual file system.
import os

def get_system_load():
    """
    Reads the load average from /proc/loadavg.
    This mimics the first line of the top command.
    """
    try:
        with open('/proc/loadavg', 'r') as f:
            load_data = f.read().split()

        # The first three fields are 1, 5, and 15 min load averages
        load_1, load_5, load_15 = load_data[:3]

        print(f"--- System Load Monitor ---")
        print(f"1 Min Load:  {load_1}")
        print(f"5 Min Load:  {load_5}")
        print(f"15 Min Load: {load_15}")

        # Simple alert logic
        if float(load_1) > 1.0:
            print("[WARNING] High immediate load detected!")

    except FileNotFoundError:
        print("Error: /proc/loadavg not found. Are you on a Linux system?")

if __name__ == "__main__":
    get_system_load()
This script demonstrates the underlying mechanism of Linux Monitoring tools. By reading /proc/loadavg, we access the same raw data the kernel exposes to top.
Section 2: Process Management and Interaction
Below the summary lies the task list. By default, processes are sorted by CPU usage, but a skilled administrator knows how to manipulate this view to find memory leaks or I/O bottlenecks. This is where Linux Permissions and process management come into play.
Key Columns Explained
Understanding memory columns is vital for Performance Monitoring:
Apple TV 4K with remote – New Design Amlogic S905Y4 XS97 ULTRA STICK Remote Control Upgrade …
- VIRT (Virtual Memory): The total amount of virtual memory used by the task. It includes all code, data, and shared libraries plus pages that have been swapped out.
- RES (Resident Memory): The non-swapped physical memory a task is using. This is usually the most accurate representation of actual RAM usage.
- SHR (Shared Memory): The amount of shared memory used by a task. It reflects memory that could be potentially shared with other processes.
If you are managing a PostgreSQL Linux or MySQL Linux database, you will often see high VIRT usage, which is normal. However, high RES usage that grows over time indicates a memory leak.
Interactive Commands
While top is running, you can use single-key commands to interact with it:
k: Kill a process. You will be prompted for the PID. This sends a signal (default SIGTERM) to the process.r: Renice a process. Change the priority of a running task. Requires root or sudo privileges for lowering the nice value (increasing priority).1: Toggle between showing a single CPU summary and individual CPU cores. Essential for detecting single-threaded application bottlenecks on multi-core Linux Servers.c: Toggle the command line column between the process name and the full command path/arguments.
For Linux Automation, you might want to identify high-memory processes programmatically without entering the interactive shell. Here is a Bash Scripting example that acts like a snapshot of top specifically for memory hogs.
#!/bin/bash

# Memory Hog Finder
# This script lists the top 5 processes by memory usage
# Useful for quick diagnostics on Debian Linux or CentOS servers

echo "----------------------------------------------------"
echo "  Top 5 Memory Consuming Processes on $(hostname)"
echo "----------------------------------------------------"

# ps command options:
# -e: Select all processes
# -o: User-defined format
# --sort: Sort by resident set size (rss) descending

ps -eo pid,ppid,cmd,%mem,%cpu --sort=-%mem | head -n 6

echo "----------------------------------------------------"

# Check for swap usage
SWAP_USED=$(free | grep Swap | awk '{print $3}')

if [ "$SWAP_USED" -gt 0 ]; then
    echo "[ALERT] System is swapping! Used Swap: ${SWAP_USED}KB"
else
    echo "[OK] No swap usage detected."
fi
Section 3: Advanced Techniques and Batch Mode
The true power of top for Linux DevOps professionals lies in its batch mode. Interactive mode is great for “now,” but batch mode is essential for logging performance data over time or piping output to other tools.
Logging with Batch Mode
Using the -b flag allows top to stream output to stdout, which can be redirected to a file. This is incredibly useful for post-mortem analysis when a server crashes overnight.
Command: top -b -n 1 > top-snapshot.txt
You can combine this with Python Automation to create a custom monitoring agent that triggers actions based on specific process behavior. The following example uses Python to run top in batch mode, parse the output, and detect if a specific user (e.g., ‘www-data’ for Apache or Nginx) is consuming too much CPU.
import subprocess
import re
import time

def monitor_user_cpu(target_user, threshold):
    """
    Runs top in batch mode to check if a specific user's processes
    exceed a CPU threshold.
    """
    print(f"Monitoring user '{target_user}' for CPU > {threshold}%...")

    # Run top in batch mode (-b), one iteration (-n 1)
    # We filter specifically to make parsing easier, but standard top works too.
    cmd = ["top", "-b", "-n", "1", "-u", target_user]

    try:
        result = subprocess.run(cmd, capture_output=True, text=True)
        lines = result.stdout.split('\n')

        # Skip headers, start processing process list
        # Usually process list starts around line 7 in default config
        process_lines = lines[7:]

        for line in process_lines:
            if not line.strip():
                continue

            parts = line.split()
            # Standard top columns: PID USER PR NI VIRT RES SHR S %CPU %MEM TIME+ COMMAND
            # %CPU is usually index 8
            try:
                pid = parts[0]
                cpu_usage = float(parts[8])
                command = parts[-1]

                if cpu_usage > threshold:
                    print(f"[ALERT] High CPU: User {target_user} | PID {pid} | {cpu_usage}% | Cmd: {command}")
                    # In a real scenario, you might log this to a file or send a Slack webhook

            except (IndexError, ValueError):
                continue

    except Exception as e:
        print(f"Error executing top: {e}")

if __name__ == "__main__":
    # Example: Check if any 'root' process is using more than 50% CPU
    while True:
        monitor_user_cpu("root", 50.0)
        time.sleep(10)
Filtering and Custom Configuration
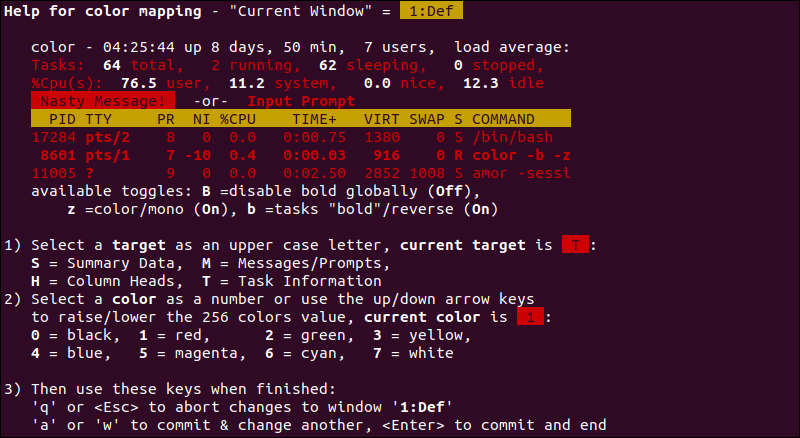
You can create a custom view by pressing f inside top. This enters the Field Management screen where you can add columns like P (Last used CPU) or v (Major Page Faults). Once you have configured top to your liking, press W (shift+w) to write the configuration to ~/.toprc. This ensures your Linux System view remains consistent across sessions.

Section 4: Best Practices and Optimization
Apple TV 4K with remote – Apple TV 4K 1st Gen 32GB (A1842) + Siri Remote – Gadget Geek
While top is powerful, relying on it blindly can lead to misdiagnoses. Here are best practices for Linux Administration when using performance monitoring tools.
1. Don’t Ignore I/O Wait
If your system feels sluggish but CPU usage (us + sy) is low, check the wa (wait) percentage. High wait times usually indicate a bottleneck in Linux Disk Management (slow HDD, saturated SSD) or network file systems (NFS). In these cases, tools like iotop are better suited than standard top.
2. Security and Permissions
By default, users can see all processes. On a shared Linux Server, you may want to restrict users to seeing only their own processes for Linux Security reasons. This can be achieved by mounting /proc with the hidepid=2 option. This prevents users from snooping on command line arguments of other users, which might contain sensitive API keys or passwords.
3. Understanding “Steal” Time
In the age of Linux Cloud computing (AWS, Azure), the st metric is vital. If this value is high, it means the hypervisor is restricting your virtual machine’s access to the physical CPU. No amount of code optimization in your Python Scripting or C Programming will fix this; you need to upgrade your instance type or move to a less noisy host.
Apple TV 4K with remote – Apple TV 4K iPhone X Television, Apple TV transparent background …
4. Alternatives and Complements
While top is standard, other tools offer different perspectives:
- htop: A more visual, colorful interactive viewer that allows vertical and horizontal scrolling.
- atop: Excellent for historical analysis; it logs snapshots allowing you to “go back in time.”
- glances: A Python-based monitoring tool that provides a dashboard view of CPU, Disk, Network, and even Docker Tutorial container stats.
To truly understand the “cost” of a process, we can look at a low-level C Programming Linux example. This snippet reads the process status directly, showing how lightweight monitoring tools are built using GCC and system calls.
#include
#include
#include

// A simple C tool to read process status
// Compile with: gcc -o proc_check proc_check.c

void print_process_status(int pid) {
    char filename[256];
    char buffer[1024];
    FILE *fp;

    sprintf(filename, "/proc/%d/status", pid);
    fp = fopen(filename, "r");

    if (fp == NULL) {
        printf("Could not open status file for PID %d\n", pid);
        return;
    }

    printf("--- Status for PID %d ---\n", pid);
    while (fgets(buffer, sizeof(buffer), fp)) {
        // Only print Name, State, and VmSize
        if (strncmp(buffer, "Name:", 5) == 0 ||
            strncmp(buffer, "State:", 6) == 0 ||
            strncmp(buffer, "VmSize:", 7) == 0) {
            printf("%s", buffer);
        }
    }
    fclose(fp);
}

int main(int argc, char *argv[]) {
    if (argc != 2) {
        printf("Usage: %s \n", argv[0]);
        return 1;
    }

    int pid = atoi(argv[1]);
    print_process_status(pid);
    return 0;
}
Conclusion
The top command is more than just a task manager; it is a comprehensive dashboard for Linux System health. From diagnosing high load averages on a Fedora Linux workstation to monitoring memory leaks in a Python Linux application, top provides the raw data necessary for informed decision-making.
By mastering the interactive shortcuts, understanding the nuances of memory columns (VIRT vs RES), and leveraging batch mode for Linux Automation, you elevate yourself from a casual user to a power user. As you continue your journey in Linux Administration, remember that tools like top, htop, and custom scripts are your eyes and ears. Regular monitoring, combined with a deep understanding of the Linux Kernel metrics, ensures your infrastructure remains robust, secure, and performant.